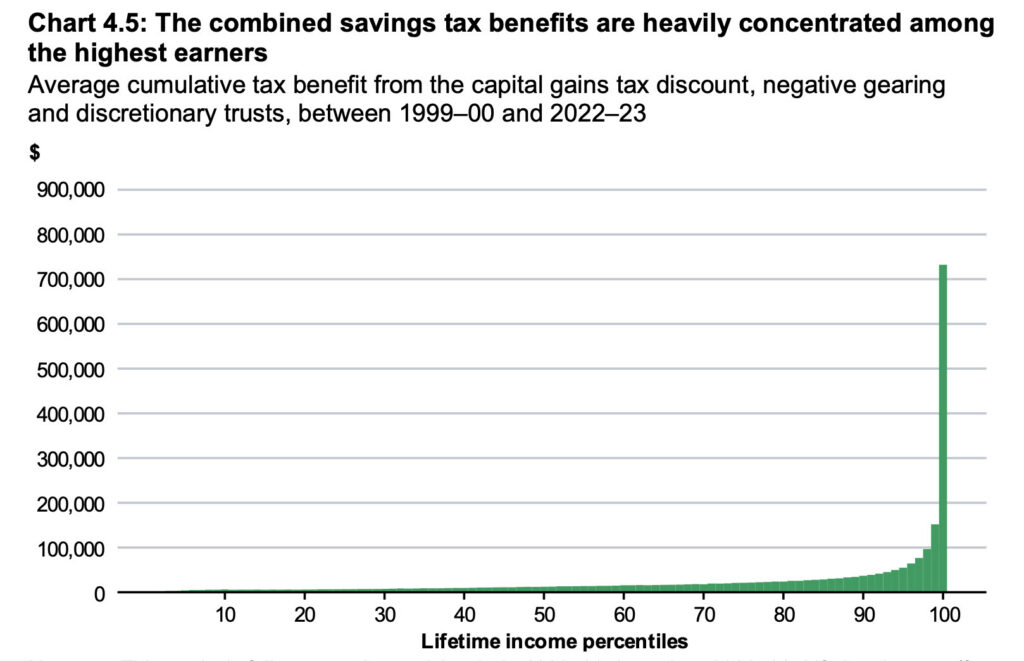
The bright minds on the ABC’s “The Economy Stupid” led by economics writer Peter Martin pointed to one key graph in the stack of Budget papers that every Aussie needs to see, and consider carefully.
The graph reveals that the housing investment and trusts tax concessions have benefited mostly the few, rather than the many. The tax savings are concentrated in a narrow band at the higher end of income earners.
This week’s budget removed those advantages:
• Negative gearing of investment property is restricted to new builds only, from July 2027. (Existing negatively geared property is grandparented).
• A Capital Gains Tax discount, which required people to pay tax on only half their capital gains from investment assets, has been removed. The tax rate on those capital gains will be at least 30 per cent.
Exemptions to the change include new builds and affordable housing.
Another big change is the imposition of a minimum tax of 30 per cent on income from trusts, often used for “income splitting.”
The graph can be found in “Tax reform for workers, business and future generation”, Budget Paper No. 1, Statement 4, page 142.
It is worth contrasting the now-abolished tax concessions, which have acted to concentrate wealth, to the Jubilee system in the Old Testament, which was intended to balance reward for effort with a basic equality in Israel:
“‘Count off seven sabbath years—seven times seven years—so that the seven sabbath years amount to a period of forty-nine years. Then have the trumpet sounded everywhere on the tenth day of the seventh month; on the Day of Atonement sound the trumpet throughout your land. Consecrate the fiftieth year and proclaim liberty throughout the land to all its inhabitants. It shall be a jubilee for you; each of you is to return to your family property and to your own clan.” (Leviticus 25:8-10, NIV)
Israelites could “return to the family property” because in the jubilee year, land was returned to the original owner’s family. “…what was sold will remain in the possession of the buyer until the Year of Jubilee. It will be returned in the Jubilee, and they can then go back to their property.” (Leviticus 25:28, NIV)
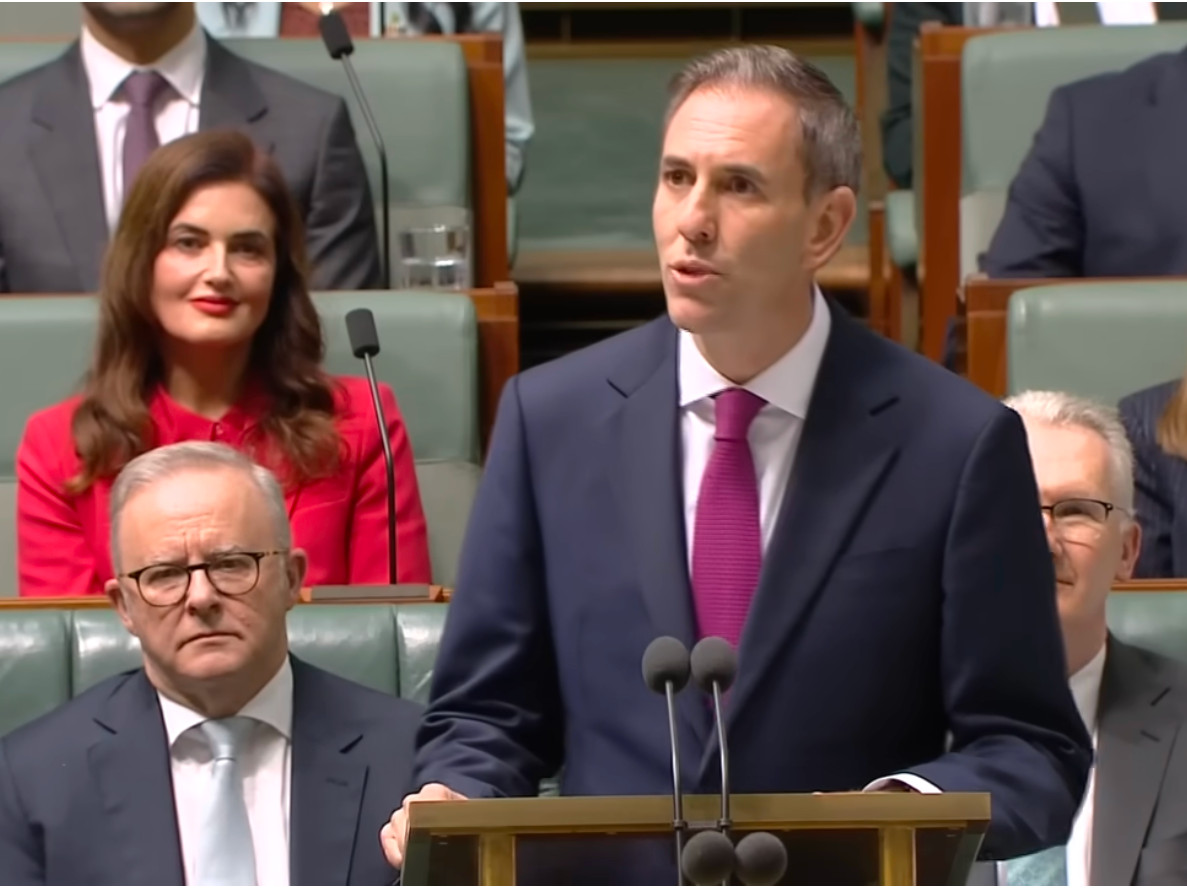
Image: Jim Chalmers’ budget speech. Image credit: Seven
John. This graph is very obscure. So here’s ChatGPT’s explanation:
A simple mental picture
Imagine lining up 100 Australians from poorest lifetime earnings to richest lifetime earnings.
The chart shows:
people near the left end get little from these tax concessions
people near the far right get progressively more
the richest few get extraordinarily large benefits.